Factors
Nine factors that follow the factor definitions in Mählmann and Sukonnik (2022) and Mählmann and Reck (2024), adapted to the information available in public fund filings.
| Code | Factor | Signal | Preferred side |
|---|---|---|---|
value | Value (PD) | Spread-to-maturity divided by a model-implied 12-month default probability | High |
momentum | Momentum | Cumulative excess return over months t−3 to t−1 | High |
illiquidity | Illiquidity | Number of funds holding the loan (fewer = less liquid) | Less liquid |
quality | Quality (PD) | Model-implied 12-month default probability | Low |
low_risk | Low Risk | Spread duration | Low |
carry | Carry | Spread-to-maturity | High |
ivol | IVOL | Idiosyncratic volatility from a 12-month market model | Low |
bab | BAB | Market beta from a 12-month market model (Dimson beta) | Low |
combi | Combi | Average of the standardized signals of the eight factors above | High |
market | Market | All loans in the investable universe | – |
Reading the low-risk factors. For IVOL, BAB and Quality the preferred quintile holds the safest loans.
Their raw long-short returns are often negative, because riskier loans earn higher raw returns. The anomaly shows up
in risk-adjusted terms: the safest loans earn more than their low market exposure implies. Judge these factors by
their alpha in factor_summary.csv, not by the raw long-short spread.
How the premia unfold over time
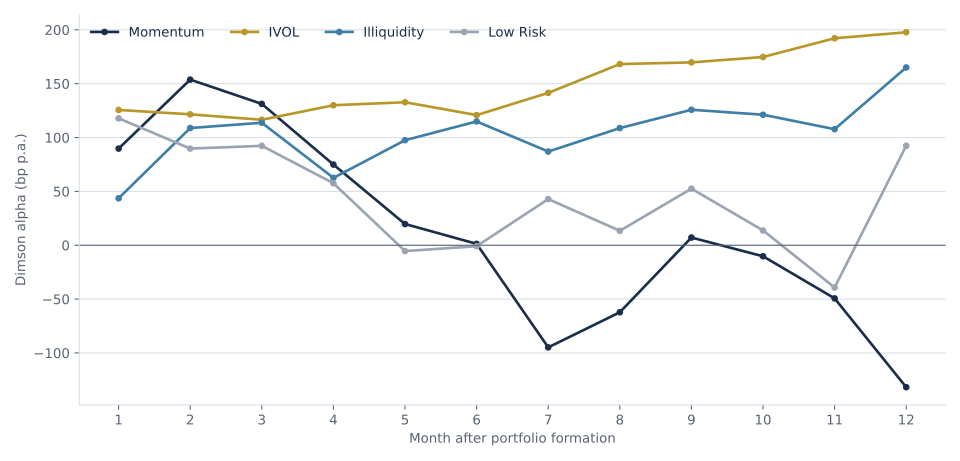
Factors differ in how long their premia last after portfolio formation. Momentum peaks two to four months after formation and fades after about six months. Low volatility (IVOL) and illiquidity earn their premia persistently. This is why the database offers several holding periods.
Portfolio construction
- Each month, loans in the investable universe with an available signal are sorted into quintiles.
- The long-short return is the preferred quintile minus the opposite quintile. The benchmark is the average of all sorted loans.
- Longer holding periods use overlapping cohorts with weights fixed at formation.
- The implementation lag delays the first holding month by one month. N-PORT data are published with about 60 days delay, so the lagged series approximate an implementable strategy.
Details are in the methodology.