Factor returns for US leveraged loans, built from public SEC data
An open database of monthly factor returns for the US leveraged loan market. Every number is derived from fund holdings reported to the SEC in Form N-PORT, so anyone can reproduce it.
- Factors
- 9 plus market
- Sample
- Oct 2019 – Apr 2026
- Loans in the universe
- about 1,200 per month
- Updates
- quarterly
Why this database
Leveraged loans are private, over-the-counter instruments. Loan-level prices are normally available only from commercial vendors whose licenses do not allow public redistribution. Research on factor investing in loans has therefore been hard to replicate and impossible to share.
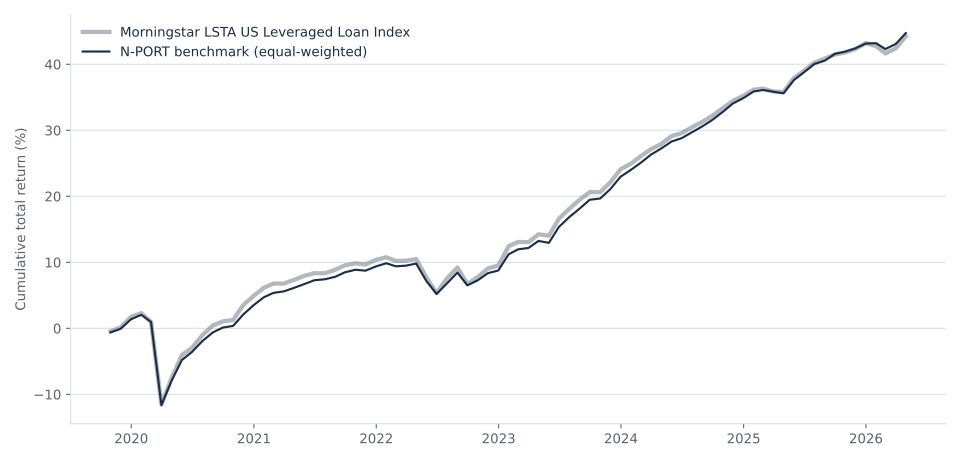
US registered investment funds, however, report every loan they hold to the SEC, with notional and fair value. Aggregated across funds, these filings track the loan market closely, as Figure 1 shows. This site turns them into factor returns that are free to use, cite and extend.
What you get
- Monthly returns of long-short, quintile and benchmark portfolios for Value, Momentum, Illiquidity, Quality, Low Risk, Carry, IVOL, BAB and a combination factor, plus a market index.
- Equal-weighted, value-weighted and capped value-weighted versions, holding periods of 1, 3, 6 and 12 months, with and without a one-month implementation lag, as excess and total returns.
- Summary statistics including Dimson alphas, signal distributions and universe statistics.
- The complete open-source pipeline from the SEC filings to the published files.